I had some trouble getting the info I needed to setup pprof in my program. And figuring out the steps to get actionable data out of pprof. So here is my attempt to provide the minimum steps needed to use pprof.
Instrument your code
import (
   _ "net/http/pprof"
    )
func main() {
   go func() { log.Println(http.ListenAndServe("localhost:6060", nil)) }()
//Your program
}
Make sure you have the above in your main.go file. This sets up a webserver that provides pprof data at the below link.
localhost:6060/debug/pprof/Heap Memory Usage
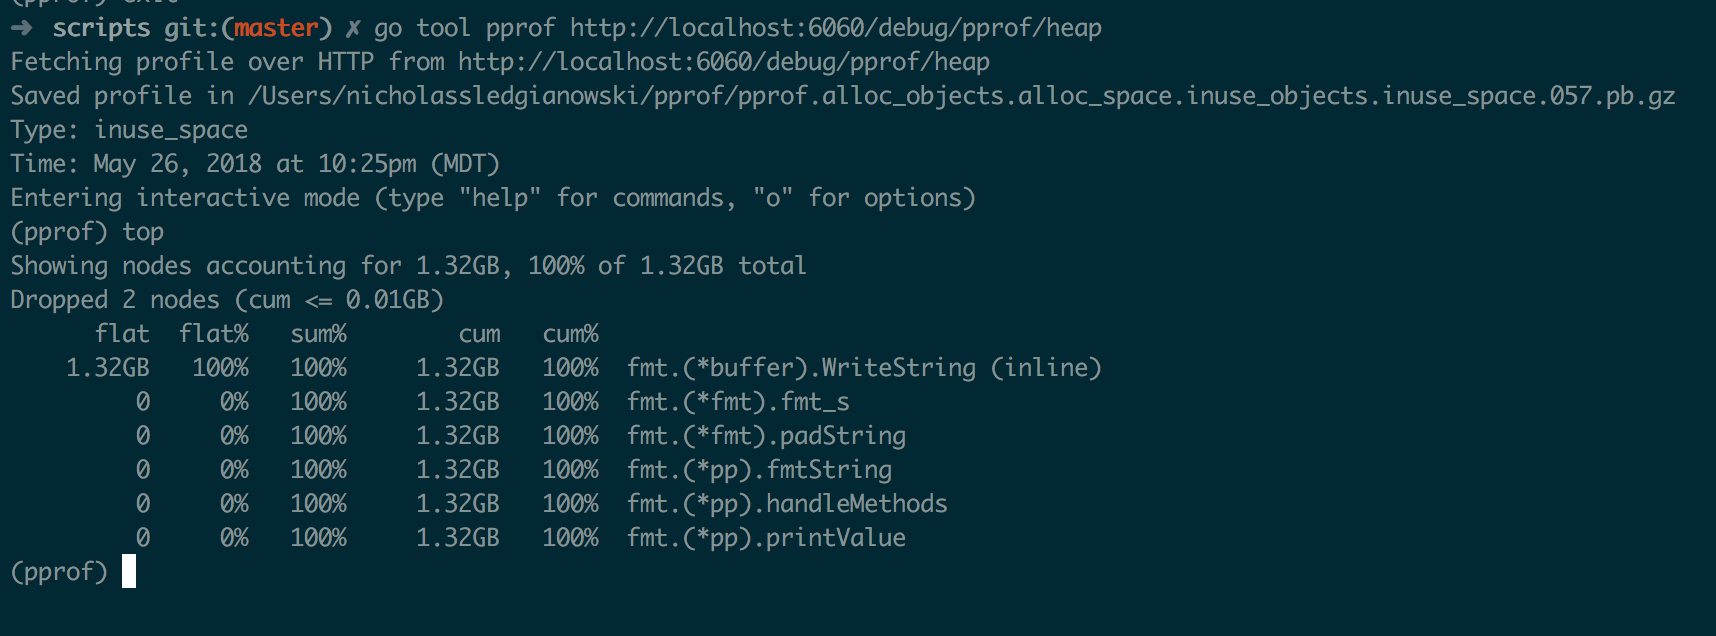
In your shell run: go tool pprof http://localhost:6060/debug/pprof/heap This will open a cli program, enter top into the prompt.

This gives you the top 10 nodes of memory usage. It will truncate the results if most of the memory is in the top 3 nodes.
CPU time
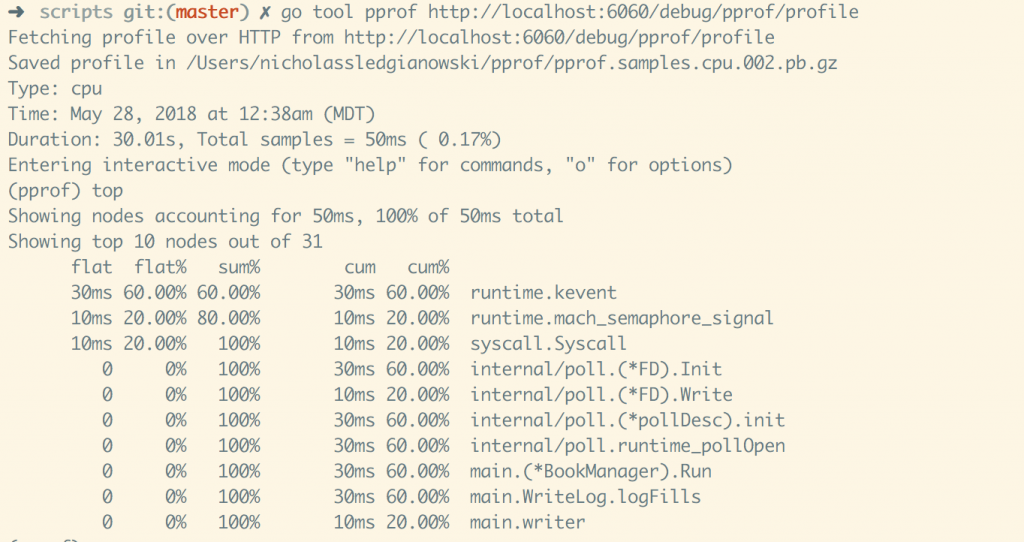
To sample 30 seconds of cpu time, with 50ms of time ‘sampled’. go tool pprof http://localhost:6060/debug/pprof/profile

pprof Godoc: https://golang.org/pkg/net/http/pprof/

