This post has moved to my new website estimating.dev. Which is the place for all information and best practices around software development project estimates.
Here is the link to this posts new home.
This post has moved to my new website estimating.dev. Which is the place for all information and best practices around software development project estimates.
Here is the link to this posts new home.
I had the opportunity to take the [CKA](https://www.cncf.io/announcement/2016/11/08/cloud-native-computing-foundation-launches-certification-training-managed-service-provider-program-kubernetes),
‘Certified Kubernetes Administrator’ exam because my employer is trying to get ‘Certified Kubernetes Service Provider’ status, which requires 3 certified administrators. Now, why would Certified Kubernetes Administrators or service providers be valuable for your company? The CKA is good because it certifies a base level of knowledge and ability in kubernetes administrators. Things you would expect from CKAs are the ability to debug clusters, perform upgrades, bootstrap clusters and application deployment tasks.
What and how does the exam test administrators? The exam tests your ability to perform operations against the kubernetes api. The entire exam period is spent in the command line with kubectl on a standard linux shell. The test validates your ability to ‘get things done’ in the kubernetes environment.
Overall, I have a very positive outlook on the exam. I spent about a week preparing. I read a lot of the kubernetes.io documentation, ran through ‘kubernetes the hard way’ three times and had worked with kubernetes on the application side previously. I passed on the first try, but I did need all of the exam time and had to skip a few of the hard problems.
I don’t think that the CKA is essential for devops or kubernetes admins, but it is a good exam and great for filling some of the gaps you might have in your knowledge.
In 2017 I had the opportunity to spend a year working as a devops or platform engineer. I have mainly worked as a software engineer before so moving in to an automate and operate role was a bit of a leap. This was a fully remote engagement where I was embedded with and helped bootstrap the client’s first platform team.
The project was building out continuous integration and delivery for a client of ours that had no AWS experience. Before they brought us in they ran all their systems in their own datacenters in a windows and .Net environment. We came in to assist with the move into the cloud and to help transition the company from .NET to Java, javascript and microservice development.
The first few months we focused on building out the CI/CD with Jenkins pipelines and a great deal of AWS cli scripting. Once we got the basics working teams started to come out of microservices training and began developing against it. This was the start of operational support for us and started a bit of a scramble while we tried to balance new features and the stability of the platform with hiring and onboarding.
We used jenkins pipelines, docker and cloudformation to provide our users with a solid customizable pipeline solution. Using our default templates development teams could easily bootstrap their pipeline with CI/CD from dev to canary deploys in production. If they needed more than a stateless microservice we enabled them to provide cloudformation templates in their github repository that would be run with each deploy to ensure the AWS environment was bootstrapped for their needs.
We started out with the intention of using Jenkins pipelines with ansible to automate things, but the client’s team was more experienced with CloudFormation and as a result I ended up writing most of our initial CI/CD code in a combination of groovy and AWS cli calls. This proved unwieldy and eventually led us to using Groovy + Cloudformation for nearly everything. Cloudformation works but it is locked into AWS and its programming model is a somewhat awkward. Cloudformation’s saving grace is the first class integration and editor. Next time I would recommend starting with a commitment to Terraform or Ansible.
In the 3rd quarter we started work on implementing Canary deployments. Our solution ended up being a combination of a customized client side load balancing http client and jenkins pipelines. I started us off with a proof of concept that proved easier to write than we expected which put us on good footing for the rest of the project. One of the client’s employees took advantage of the space we had to rewrite the shared jenkins pipeline library in more idiomatic language which turned out to be a great improvement.
We went live in Q4 and I moved on to another project. I am moving back into application development, I ended up doing 100% automation scripting instead of the 50-50 split I was expecting. So it will be good to get back to writing applications.
I started a couple projects recently, a mock crypto exchange and my latest project a unicode manipulation library. But what struck me is that its really simple to get started. You need the go runtime and a GOPATH setup.
Then you specify the package and the main method and that is a valid program.
package main

func main(){}
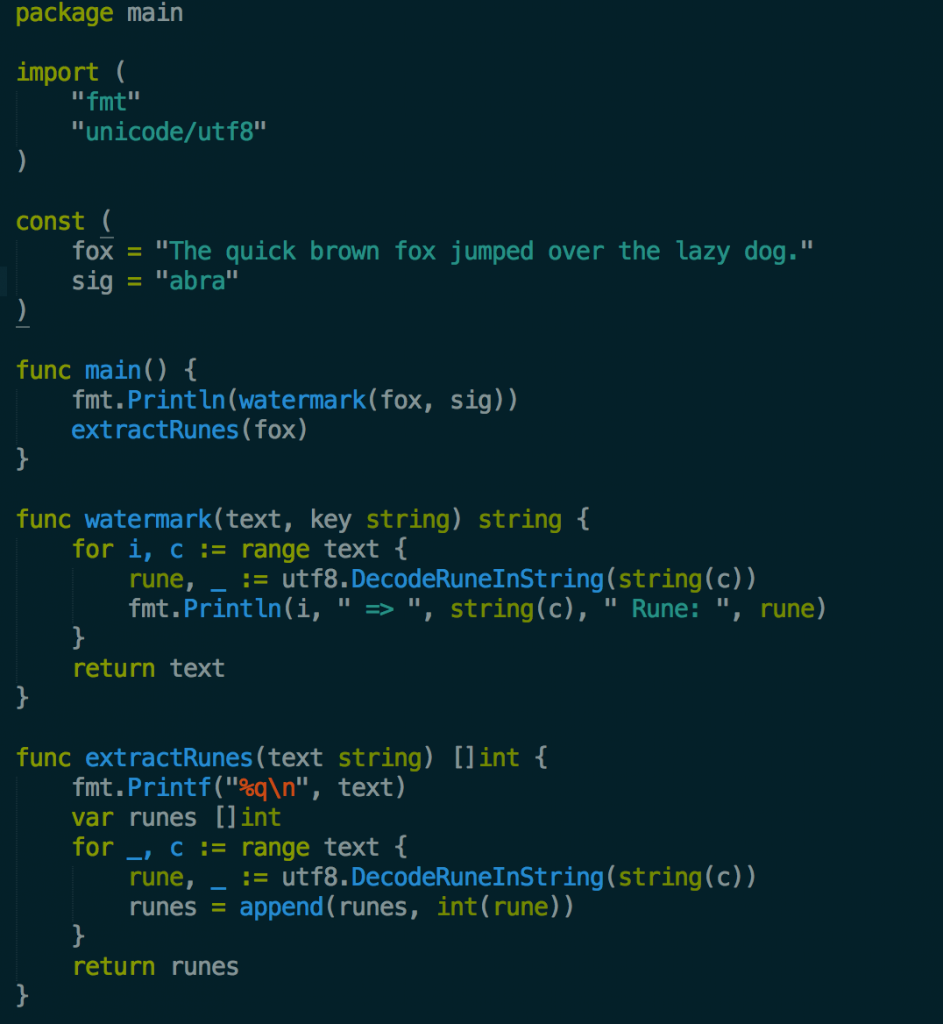
Above is my program so far. It is a short program with a bit of exploratory code that converts strings into their unicode rune ids. Back when I mainly used Java, I would have had to setup an IDE, integrated maven and think about package structure. In Go I just have a main.go file, if I need dependencies I create a /vendor directory and usego get github.com/gin-gonic/gin to pull the dependency.
Overall the lightweightness of the Go tooling makes it very easy to build small programs.
I had some trouble getting the info I needed to setup pprof in my program. And figuring out the steps to get actionable data out of pprof. So here is my attempt to provide the minimum steps needed to use pprof.
import (
   _ "net/http/pprof"
    )
func main() {
   go func() { log.Println(http.ListenAndServe("localhost:6060", nil)) }()
//Your program
}
Make sure you have the above in your main.go file. This sets up a webserver that provides pprof data at the below link.
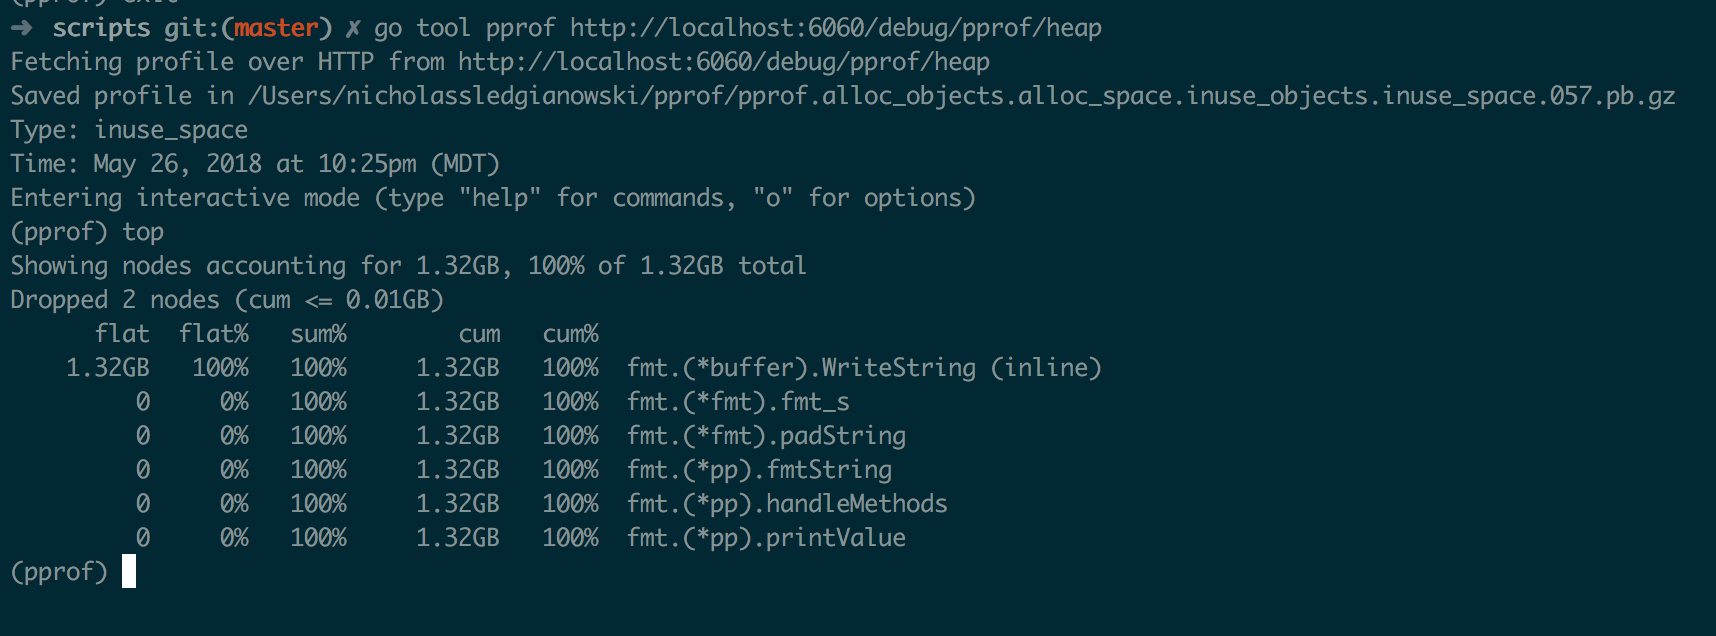
localhost:6060/debug/pprof/ In your shell run: go tool pprof http://localhost:6060/debug/pprof/heap This will open a cli program, enter top into the prompt.
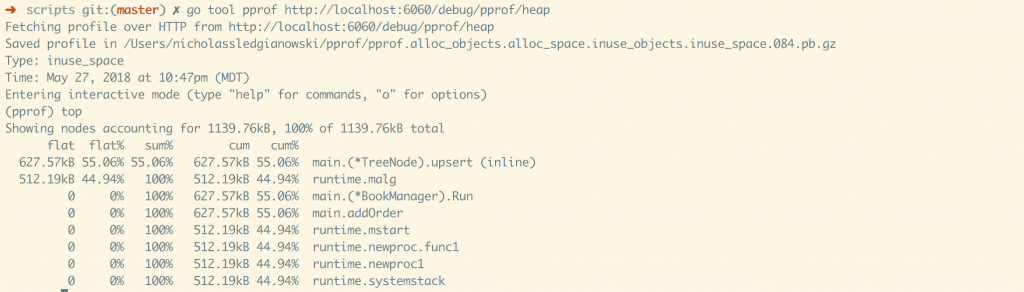
This gives you the top 10 nodes of memory usage. It will truncate the results if most of the memory is in the top 3 nodes.
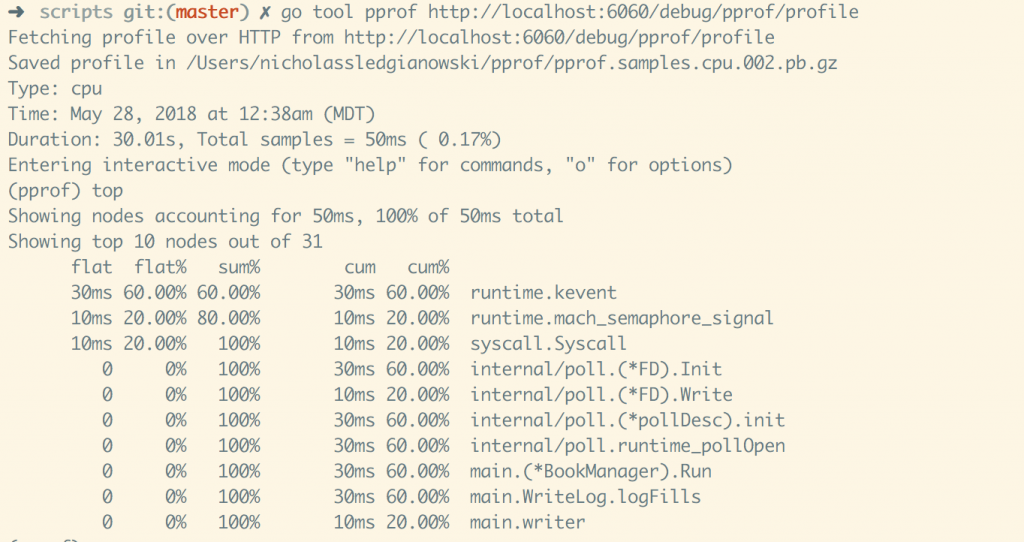
To sample 30 seconds of cpu time, with 50ms of time ‘sampled’. go tool pprof http://localhost:6060/debug/pprof/profile
pprof Godoc: https://golang.org/pkg/net/http/pprof/