I started a couple projects recently, a mock crypto exchange and my latest project a unicode manipulation library. But what struck me is that its really simple to get started. You need the go runtime and a GOPATH setup.
Then you specify the package and the main method and that is a valid program.
package main

func main(){}
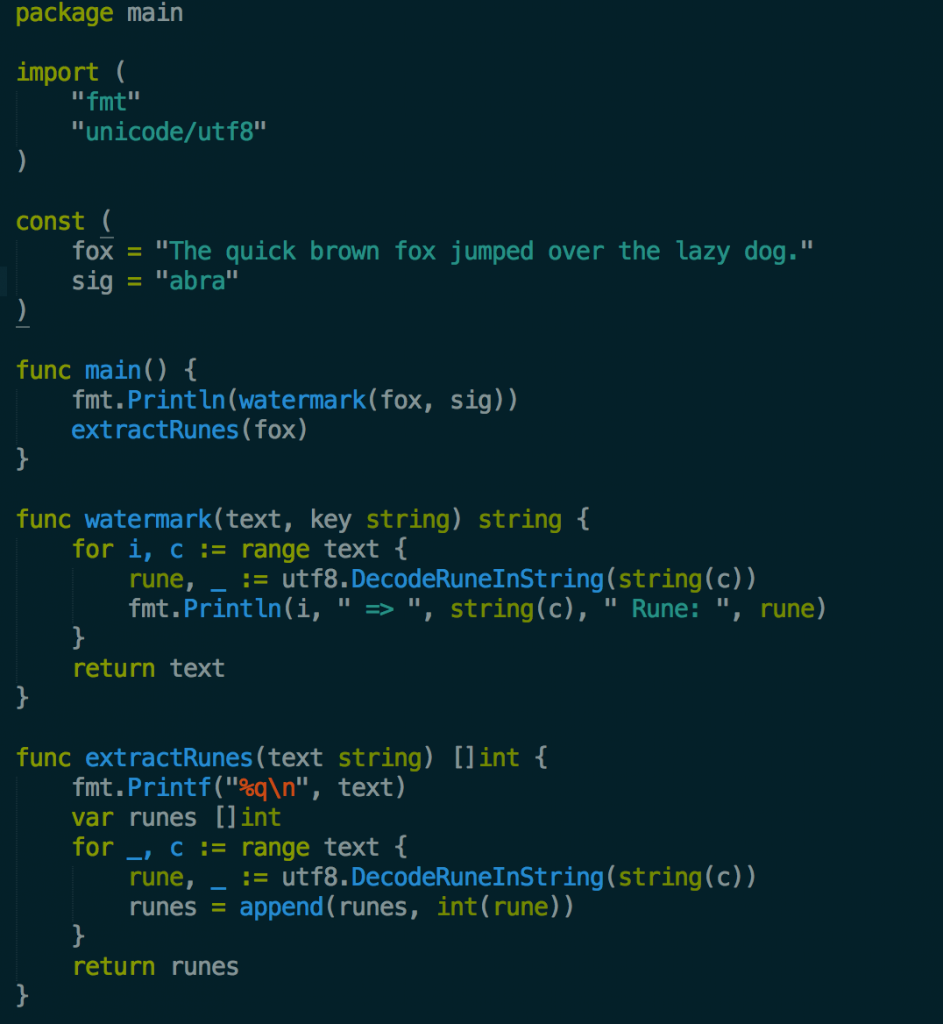
Above is my program so far. It is a short program with a bit of exploratory code that converts strings into their unicode rune ids. Back when I mainly used Java, I would have had to setup an IDE, integrated maven and think about package structure. In Go I just have a main.go file, if I need dependencies I create a /vendor directory and usego get github.com/gin-gonic/gin to pull the dependency.
Overall the lightweightness of the Go tooling makes it very easy to build small programs.